Pursuant to Florida Statute, the Collier County Clerk of the Circuit Court and Comptroller invests surplus funds for the County. The investment function is performed in house by employees of the Comptroller and monthly investment reports are available at collierclerk.com. Investment parameters are codified in the Board’s Investment Policy, adopted by Resolution 2014-260.
Historically, the portfolio strategy has relied on a buy and hold approach. Laddered purchases are made to complement cash flow fluctuations throughout the year where fewer bonds mature during ad valorem collection months (November through March) while increasing the amount of maturities during hurricane season and lower tax revenue months (June through September). Utilizing County staff reports on capital project timelines, committee meetings, and commissioner meetings, we develop a comprehensive strategy that addresses short term operating needs while ensuring funds are available for capital outlay.
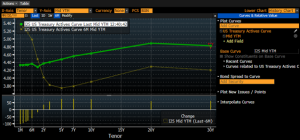
The yield curve has been decreasing inside of 2 years and increasing 3 years onward. The flatter yield curve indicates a potentially higher neutral rate and growing economic uncertainty, both of which benefit short term holdings. Since hitting a recent low of 2.4% in September 2024, inflation has increased each month since and currently sits at 3.0%, further supporting the thesis that the Fed will continue their cautious approach to rate cuts. Markets have also adjusted accordingly and are currently pricing in only one rate cut of 25 basis points by January 2026.
On the short end, the decrease in the Fed Funds Rates traditionally spurs economic growth. However, the long end indicates rising inflationary expectations or lack of economic growth. Given the dichotomy of these economic messages, it is important to maintain positions to safely account for both potential outcomes. While we are focused on ensuring safety and liquidity, we have been executing strategic purchases to both further diversify the portfolio and account for an environment where yields decrease across the curve.
As of January 31, 2025, the total portfolio has a weighted time to maturity of 1.46 years, an increase from 0.80 years as of October 2023. As a result, we expect to see the following cash flows from maturing investment principal: $438MM in FY2025, $510MM in FY2026, $282MM in FY2027, $110MM in FY2028, and $90MM in FY2029.
A critical liquidity threshold has been established at $300MM, a result of considering the three variables over the previous 5 years, (1) lowest month end available cash balance ($186MM in October 2022) plus (2) lowest month of revenues ($61MM in July 2022) less (3) the highest month of cash outflows ($190MM in June 2024). A threshold of $300MM creates a liquidity cushion of approximately $240MM above the maximum/minimum calculation to ensure sufficient demand account balance.
The portfolio currently has $1.03B, or 42.2%, of the total portfolio invested in demand accounts with overnight availability. These are invested in Local Government Investment Pools, the First Foundation Bank (FFB) concentration account, FFB Florida PRIME Indexed Account and the US Treasury. Since January 2024, when demand accounts made up 51.5% of the total portfolio, we have taken strategic long-term positions to address future cash flow needs while continuously increasing the interest earned in the portfolio.
In light of developments over the past twelve months, the aggregate impact on the portfolio has been a record number of holdings that may be sold at a profit, should additional liquidity be required. As of January 31st, 2025, 30 securities totaling $397MM in principal market value, could be sold at a profit. As previously purchased securities mature, those not needed for liquidity have been reinvested at higher rates. At this time, we expect this trend to continue.
Yield Curve vs 6M Ago:

World Interest Rate Probability – Fed Funds Rate Hikes/Cuts:
